Geographical-Information-System
Unit 01: Introduction to Geographic Information Systems
Definition, Functions and Applications of GIS
Geographic Information Technologies
-
Global Positioning Systems (GPS): a system of earth-orbiting satellites which can provide precise (100 meter to sub-cm) location on the earth’s surface.
-
Remote Sensing (RS):
- Use of satellites or aircraft to capture information about the earth’s surface.
- Digital ortho images a key product (map accurate digital photos)
-
Geographic Information Systems (GIS): Software systems with capability for input, storage, manipulation/analysis and output/display of geographic (spatial) information.
-
GPS and RS are sources of input data for a GIS.
-
GI Systems provide the means for storing, manipulating and making effective use of GPS and RS data.
Definitions
-
“a system of hardware, software, and procedures designed to support the capture, management, manipulation, analysis, modeling, and display of spatially referenced data for solving complex planning and management problems.” (Rhind, 1989)
-
“a computer system capable of assembling, storing, manipulating, and displaying geographically referenced information.” (USGS, 1997)
-
“a computer system that allows the analysis and display of data with a spatial component.” (Phillips, 2002).
-
“a set of computer-based systems for managing geographic data and using those data to solve spatial problems” (Lo & Yeung, 2002).
-
A geographic information system (GIS) is a computer system for capturing, storing, checking, and displaying data related to positions on Earth’s surface. GIS can show many different kinds of data on one map, such as streets, buildings, and vegetation.
-
A GIS is a computer-based system that provides the following four sets of capabilities to handle georeferenced data:
-
Data Capture and Preparation
-
Data Management, including Storage and Maintenance
-
Data Manipulation and Analysis
-
Data Presentation
-
-
Geographic Information Systems (GIS) is a technological system that leverages locational and tabular data, computer hardware, and software to gather, map, and analyze geographically referenced data. GIS allows users to organize, visualize, and analyze different layers of data by creating maps and scenes.
-
GIS gives you the power to:
- create maps,
- integrate information,
- visualize scenarios,
- present powerful ideas, and
- develop effective solutions.
-
Geospatial data describe both the locations and characteristics of spatial features. To describe a road, for example, we refer to its location (i.e., where it is) and its characteristics (e.g., length, name, speed limit, and direction).
The major areas of GIS application
- Local Government
- Public Works/Infrastructure Management (Roads, Water, Sewer)
- Planning and Environmental Management
- Property Records and Appraisal
- Real Estate and Marketing
- Retail Site Selection, Site Evaluation
- Public Safety and Defense
- Crime Analysis, Fire Prevention, Emergency Management, Military/Defense
- Natural Resource Exploration/Extraction
- Petroleum, Minerals, Quarrying
- Transportation
- Airline Route Planning, Transportation Planning/ Modeling
- Health Management: (Health Systems, Health Centers, Management Beds)
- Public health and epidemiology
- The Geospatial Industry
- Data Development, Application Development, Programming
Examples of Applied GIS
- Urban Planning, Management & Policy
- Zoning, Subdivision Planning
- Land Acquisition
- Economic Development
- Code Enforcement
- Housing Renovation Programs
- Emergency Response, Crime Analysis, Tax Assessment
- Environmental Sciences
- Monitoring environmental risk
- Modeling storm water runoff
- Management of watersheds, floodplains, wetlands, forests, aquifers
- Environmental Impact Analysis
- Hazardous or toxic facility siting
- Groundwater modeling and contamination tracking
- Political Science
- Redistricting
- Analysis of election results
- Predictive modeling
- Civil Engineering/Utility
- Locating underground facilities
- Designing alignment for freeways, transit
- Coordination of infrastructure maintenance
- Business
- Demographic Analysis
- Market Penetration/ Share Analysis
- Site Selection
- Education Administration
- Attendance Area Maintenance
- Enrollment Projections
- School Bus Routing
- Real Estate
- Neighborhood land prices
- Traffic Impact Analysis
- Determination of Highest and Best Use
- Health Care
- Epidemiology
- Needs Analysis
- Service Inventory
Advantages of GIS
- Cost Saving from great efficiency: The system is used to improve daily fleet activities and maintenance schedules. In implementing the system, it may cost great savings in operational expenses, staff time and have an efficient scheduling.
- Improve communication: Visualization and Geographical based maps assist in storytelling and understanding situations. This is used to improve communication between different departments, discipline, organization, professional fields, public and teams.
- Managing Geographically: The system is needed to understand what will happen and what is happening in geographic field.
- Better Records Keeping: Not just large entities or organizations needs to maintain valuable data. But each individual has important documents and data that need to be record and keep. GIS functions as maintenance and keeper of important records about the change and status of geography.
- Decision making becomes better: GIS is known for go to technology, for it makes better decision about area and location. Making right decision about certain location is hard and critical.
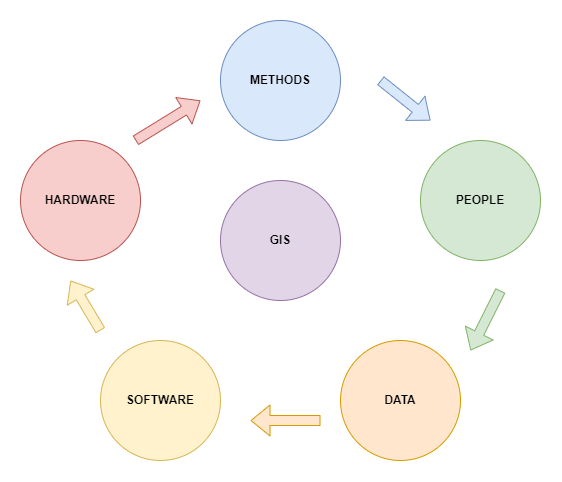
Components of GIS
-
Hardware: GIS hardware includes computers for data processing, data storage, and input/ output; printers and plotters for reports and hard-copy maps; digitizers and scanners for digitization of spatial data; and GPS and mobile devices for fieldwork.
-
Software : GIS software, either commercial or open source, includes programs and applications to be executed by a computer for data management, data analysis, data display, and other tasks.
-
Key software components are
- Tools for the input and manipulation of geographic information.
- A database management system (DBMS).
- Tools that support geographic query, analysis, and visualization.
- A graphical user interface (GUI) for easy access to tools.
- Additional applications, written in Python, JavaScript, VB.NET, or C++, may be used in GIS for specific data analyses.
- Data: The data is captured or collected from various sources (such as maps, field observations, photography, satellite imagery etc.) and is processed for analysis and presentation.
- People: The people who manage the system and develop plans for applying it to real-world problems.
- Procedures: These include the methods or ways by which data has to be input in the system, retrieved, processed, transformed and presented.
GIS as Information System
Nature and Sources of GIS Data
Spatial data formats
- Raster.
- Vector.
Raster Data Format
- Raster data represents a graphic object as a pattern of dots, whereas vector data represents the object as a set of lines drawn between specific points.
Required figure for modelling the real world
Required figure for representation of geographic details, point, line and area feature
Required figure for storing of spatial data, vector and raster data formats.
- Raster files are most often used:
- For digital representations of aerial photographs, satellite images, scanned paper maps, and other applications with very detailed images.
- When costs need to be kept down.
- When the map does not require analysis of individual map features.
- When ‘backdrop’ maps are required.
- The relationship between cell size and the number of cells is expressed as the resolution of the raster.
- A finer resolution gives a more accurate and better quality image.
Required figure for effect of grid size on data in raster format.
Vector Data Format
- A vector data model uses points stored by their real (earth) coordinates.
- Lines and areas are built from sequences of points in order.
- Lines have a direction to the ordering of the points.
- Polygons can be built from points or lines.
- Vectors can store information about topology.
Required figure for vector data model is based around the storage of coordinate pairs.
Vector files are most often used:
- Highly precise applications.
- When file sizes are important.
- When individual map features require analysis.
- When descriptive information must be stored.
Comparison of Raster and Vector Data Formats.
| Raster Model | Vector Model |
|---|---|
| Advantages | Advantages |
| Simple Data Stucture | Compact data structure |
| Easy and efficient overlaying | Efficient for network analysis |
| Compatible with RS imagery | Efficient projection transformation |
| High spatial variability is efficiently represented | Accurate map output |
| Simple for own programming | |
| Same grid cells for several attributes | |
| Disadvantages | Disadvantages |
| Inefficient useof computer storage | Complex data structure |
| Errors in perimeter and shape | Difficult overlay operations |
| Difficult network analysis | High spatial variability is inefficiently represented |
| Inefficient projection transformations | Not compatible with RS imagery |
| Loss of information when using large cells less accurate (although interactive) maps |
Choice between Raster and Vector Data
| Raster | Vector | |
|---|---|---|
| Data Collection | Rapid | Slow |
| Data Volume | Large | Small |
| Data Structure | Simple | Complex |
| Geometrical Accuracy | Low | High |
| Graphic Treatment | Average | Good |
| Area Analysis | Good | Average |
| Network Analysis | Poor | Good |
| Generalization | Simple | Complex |
Data Capture
- GIS can contain a wide variety of geographic data types originating from many diverse sources.
- From the perspective of creating geographic databases, it is convenient to classify rather and vector geographic data as primary and secondary.
General Classification of Geographic Data
| Source | Raster | Vector |
|---|---|---|
| Primary | ∙ Digital aerial photographs | ∙ Survey measurements |
| ∙ Digital remote sensing images | ∙ GPS measurements | |
| Secondary | ∘ Scanned maps | ∘ Topographic maps |
| ∘ Photographs | ∘ Toponymy databases (Place names) | |
| ∘ DEM generated from maps |
Primary Data Sources
- They are those collected specifically for use in GIS.
- Typical primary GIS sources include raster IRS, SPOT and IKONOS Earth satellite images, and vector building survey measurements captured using a total survey station.
Secondary Data Sources
- They are those that were originally captured for another purpose and need to be converted into a form suitable for use in a GIS project.
- Typical secondary sources include raster scanned color aerial photographs of urban areas, and USGS and IGN paper maps that can be scanned and vectorized.
- Geographic data may be obtained in either digital or analog format.
- Analog data must always be digitized before being added to a geographic database.
- Depending on the format and characteristics of the digital data, considerable reformatting and restructuring may be required prior to import.
- The processes of data collection are also variously referred to as data capture, data automation, data conversion, data transfer, data translation, and digitizing.
- They essentially describe the same thing, i.e., adding geographic data to a database.
Possible encoding methods for different data sources
| Data Source | Analogue or Digital Source | Possible Encoding Method | Examples |
|---|---|---|---|
| Tabular Data | Analogue | ∙ Keyboard | ∙ List of School |
| ∙ Text Scanning | ∙ Education Board Publications | ||
| Map Data | Analogue | ∙ Digitizing | ∙ Political Maps |
| ∙ Scanning | ∙ Historical Maps | ||
| Aerial Photo | Analogue | ∙ Digitizing | ∙ Landuse Maps |
| ∙ Scanning | ∙ Water Bodies | ||
| Tabular Data | Digital | ∙ Digital File Transfer | ∙ Census Data |
| Satellite Image | Digital | ∙ Digital File Transfer | ∙ Landuse Data |
Primary Geographic Data Capture
Primary geographic captures involves the direct measurement of objects.
- Raster Data Capture
- The most popular form of primary raster data capture is remote sensing.
- Remote sensing is a technique used to derive information about the physical, chemical, and biological properties of objects without direct physical contact.
- Information is derived from measurements of the amount of electromagnetic radiation reflected, emitted, or scattered from objects.
- As used here, the term remote sensing subsumes the fields of satellite remote sensing and aerial photography.
- From the GIS perspective, resolution is the key physical characteristic of remote sensing systems.
-
Three basic aspects to resolution: spatial, spectral, and temporal.
- Spatial Resolution refers to the size of object that can be resolved and the most usual measure is the pixel size.
- Spectral Resolution refers to the parts of the electromagnetic spectrum that are measured.
- Temporal Resolution, or repeat cycle, describes the frequency with which images are collected for the same area.
- Aerial photographs
- They are normally collected using analog optical cameras and then later rasterized, usually by scanning a film negative.
- The quality of the optics of the camera and the mechanics of the scanning process both affect the spatial and spectral characteristics of the resulting images.
- Aerial photographs are very suitable for detailed surveying and mapping projects.
- Satellite and Aerial Photography systems can provide stereo imagery from overlapping pairs of images.
- These images are used to create a 3D model from which 3D coordinates, contours and digital elevation models can be created.
-
Vector Data Capture
Two main branches are ground surveying and GPS
Surveying
- Ground surveying is based on the principle that the 3-D location of any point can be determined by measuring angles and distances from other known points.
- Total stations can measure both angles and distances to an accuracy of 1 millimeter; automatically log data and the most sophisticated can create vector point, line, and polygon objects in the field, thus providing direct validation.
- Ground survey is a very time-consuming and expensive activity, but it is still the best way to obtain highly accurate point locations.
- Typically used for capturing buildings, land and property boundaries, manholes, and other objects that need to be located accurately.
- Also employed to obtain reference marks for use in other data capture projects
GPS
- The Global Position System (GPS) is a collection of 27 NAVSTAR(navigation satellite timing and ranging) satellites orbiting the Earth at a height of 12,500 miles, five monitoring stations, and individual receivers.
- GPS has revolutionized primary data capture, especially since the development of Differential GPS (Box 11), the removal of selective availability, and the creation of low-cost, low-power receivers.
- Selective availability was removed in May 2000, so that now users can fix the location of objects relatively easily to an accuracy of better than 10 m.
- Today units costing less than $100 can easily provide locational data at better than 10 m accuracy.
- The drawback of GPS is that it is necessary to have three or more satellites in unobstructed view in order to collect measurements.
- For example, in forests and urban areas with tall buildings.
Secondary Geographic Data Capture
-
Raster Data Capture Using Scanners
Three main reasons to scan hardcopy media are
- Documents are scanned to reduce wear and tear, improve access, provide integrated database storage, and to index them geographically
- Film and paper maps, aerial photographs, and images are scanned and georeferenced so that they provide geographic context for other data
- Maps, aerial photographs and images are scanned prior to vectorization
-
Vector Data Capture
- Secondary vector data capture involves digitizing vector objects from maps and other geographic data sources.
- Table digitizing, heads-up digitizing, photogrammetry, and COGO data entry are used for vector data.
Heads-up digitizing and vectorization
- Vectorization is the process of converting raster data into vector data.
- Heads-up digitizing :The simplest way to create vectors from raster layers is to digitize vector objects manually straight off a computer screen using a mouse or digitizing cursor.
- It is widely used for selective capture of, for example, land parcels, buildings, and utility assets.
Photogrammetry
- Is the science and technology of making measurements from pictures, aerial photographs, and images.
- Measurements are captured from overlapping pairs of photographs using stereo plotters.
- Orthoimages are images corrected for variations in terrain using a DEM.
- A Digital Elevation Model (DEM) is a representation of the bare ground (bare earth) topographic surface of the Earth excluding trees, buildings, and any other surface objects
- Photogrammetry is a very cost-effective data capture technique that is sometimes the only practical method of obtaining detailed topographic data
COGO data entry
- COGO is a contraction of the term coordinate geometry, a methodology for capturing and representing geographic data.
- COGO uses survey-style bearings and distances to define each part of an object
- COGO data are very precise measurements and are often regarded as the only legally acceptable definition of land parcels.
Obtaining data from external sources (data transfer)
- Some of data captured by others are freely available, but many of them are sold as a commodity from a variety of outlets including, increasingly, Internet sites.
- The characteristics and availability of datasets are constantly changing so those seeking an up-to-date list should consult one of the good online sources.
- The best way to find geographic data is to search the Internet using one of the specialist geographic search engines such as the US NSDI Clearinghouse or the Geography Network.
- An interesting new trend initiated by the Geography Network Project is the idea of providing data online in ready-to-use GIS formats.
- The Geography Network is global collection of data users and providers connected by the Internet.
- Information about available data sources can be found by consulting the Geography Network Website.
Recent trends and future of GIS
Current Trends in GIS
- Data Collection and Analytics
- Open-Source Mapping
- Access
- Workforce
Data Collection and Analytics
- Real-time data collection has helped industries such as eCommerce and research make data-driven decisions.
- For instance, an application such as eLocust3 collects rainfall data, vegetation data, and soil data in real time. It then sends the data to the headquarters where it’s analyzed and used to create distribution maps of where locusts may hit next. small satellite and drones have increased the rate at which remote sensing data is available for analysis.
- Internet of Things (IoT), phones, cars, and electronic devices are designed to collect data and make it accessible to users.
- GIS computing capabilities, such as the use of Python and R, makes it possible to handle bulk data all at once.
Open-Source Mapping
- There are several open-source software that enables users to interact with spatial data. A good example is OpenStreetMaps which engages locals to share their data by participating in mapping projects.
- As a result, they have been able to update maps of inaccessible areas, create distribution maps on disaster-stricken areas, and even update the topographic maps for major city centers.
Access
- As a result of the open-source mapping, and the numerous GIS applications, a lot of people have access to geographic data. This may be a good thing since now; more industries can take advantage of data to make better decisions.
Workflow
- Users in Geography, Geospatial Engineering, Geomatics, or any other related field are equipped with critical thinking and analytical skills that help them derive more information from Geographic data. To effectively apply GIS in various industries, the workforce will need to learn the theoretical aspect of collecting and analyzing Geographic data.
Upcoming Technologies for Use with GIS
Big Data & Machine Learning
- With the advent of cloud computing, companies are able to store massive amounts of data in the cloud. These large datasets allow them to analyze patterns and make predictions based on the data.
- Machine learning allows computers to learn from past experiences and use those lessons to predict what might happen next.
Virtual Reality
- VR creates a completely immersive 3D environment allowing you not only to see objects but also feel in the virtual world. For example, if you were playing a game where you had to pick up a gun, you could feel the weight of the weapon in your hand.
Augmented Reality
- AR is a subset of VR(Virtual Reality). It’s an emerging technology that allows users to see virtual objects superimposed onto real-world environments. This type of technology has huge potential for both business and consumer applications.
3D Analysis/Printing
- GIS offered the possibility of visualizing one’s data in 3D, With the advent and expansion of tools such as the 3D tools in ArcGIS Pro, you can analyze our 3D world.
- This new form of manufacturing allows people to print out an object using a 3D printer and then add additional features to them.